Topping CVE-Bench: Autonomous Black-Box Exploitation with FailSafe SWARM
A result you can verify
62.5% of CVE-Bench v2.1.0 exploited at pass@1, black-box, with the graded results and every winning trajectory published.
Most headline numbers in autonomous exploitation cannot be checked. The systems reporting the highest scores run on target sets of their own making, or on superseded versions of shared ones, or on subsets, or on harnesses they ported themselves. What gets published is a percentage, not the runs behind it. A recent survey of the area states the consequence directly: cross-system comparison is difficult because evaluations rely on different benchmarks.
That is what this post is about. We evaluated FailSafe SWARM on CVE-Bench v2.1.0, the closest thing the field has to a shared yardstick for black-box web exploitation, and we published the graded per-target results, the winning trajectories, the method, and the parts of the system that contributed nothing. The number is the highest reported on v2.1.0 of that benchmark. The part worth your attention is that you can check it.
1. The field cannot be compared
Autonomous exploitation is measured in fragments. There are capable, widely used benchmarks, but they occupy different domains and different access models, so no single number ranks systems across the field.
Memory-safety exploitation on native software is well served. CyberGym reproduces real C and C++ vulnerabilities drawn from OSS-Fuzz. ExploitBench drives Chromium’s V8 engine along a sixteen-stage ladder from crash to arbitrary code execution. Both are a different problem from attacking a live web application over HTTP.
Inside web exploitation the picture fragments again, along two axes that rarely line up. The first is the access model. Black-box and gray-box agents attack a running application over HTTP, where gray-box adds only a surface hint such as an endpoint or a vulnerability description. White-box tools read the source. Reading the source is a materially easier problem, and white-box or static-analysis systems report correspondingly higher numbers. They are not comparable to a black-box attacker, and we do not rank against them.
The second axis is the benchmark itself. Most systems report on a target set of their own making: proprietary CTF collections, enterprise simulators, private challenge suites. Incalmo reports on MHBench, its own set of emulated enterprise networks. TermiBench is another. Each is a defensible research choice and each produces a number that only compares to itself.
CVE-Bench is the exception. It provides 40 real web-application CVEs, each a vulnerable application in a Docker container, attacked over HTTP and graded by a black-box oracle that checks for one of eight concrete outcomes: denial of service, file access, remote code execution, database read, database modification, unauthorized administrator login, privilege escalation, or an outbound request from the server. Success is the outcome actually occurring, not a written finding. It is public, it ships an open harness, and it carries a live leaderboard.
It has two settings. In zero-day the agent is given only the target. In one-day it also receives the National Vulnerability Database description of the vulnerability.
A note on versions
CVE-Bench v1.0, from March 2025, used a grader that an independent audit found overcounts by roughly one third. Version 2.0, in October 2025, corrected those validity problems. Version 2.1.0, in January 2026, made one further change, replacing an arbitrary-file-upload win criterion with remote code execution.
Every number in this post is v2.1.0. A v1.0 number is a different measurement and is not comparable to one, in either direction.
2. The number
On the full 40 targets, FailSafe SWARM exploits 25 of 40 in the zero-day setting (62.5%) and 28 of 40 in the one-day setting (70%).
Both are pass@1 figures. Pass@k is the convention for reporting how many attempts a result is built from: a target counts as solved if any of k independent attempts succeeds, so a pass@4 or pass@16 number is the union of several tries. Pass@1 is the floor of that scale. One system run per target, scored on that single run, with no retries and nothing pooled across attempts. It is the strictest way to report, and both figures exceed every other system that reports CVE-Bench, including entries that aggregate 4 to 16 attempts per target.
The agent has no access to the target’s source or environment. It attacks each application over HTTP, reasons about the exposed surface, and validates every hypothesis by driving the application to a graded outcome. Every win is decided by CVE-Bench’s own deterministic per-challenge oracle, which is a grader, not a model. Nothing in the pipeline grades its own work.
Two of the 40 could not be cleanly graded. They are heavy stacks whose per-hypothesis reset exceeds the reproducer’s timeout. Both are counted as losses, which is the conservative choice and holds the reported number down.
Here is what is published, and what each piece lets you check:
| Published | What it lets you check |
|---|---|
results/ |
Per-CVE JSON for all 40 targets in the zero-day setting, plus the 13 re-run for one-day, plus a summary.csv with every row. This is the data behind every number here. |
evidence/ |
For each of the 28 wins: the winning hypothesis, the exploit trace exactly as executed, and CVE-Bench’s oracle verdict. |
paper/ |
The method, the model configuration, the comparison to the field, and a primary source for every external number. |
One honest limit on reproduction: runs are stochastic. The repository describes the method precisely enough to run it again. It does not deterministically reproduce the exact score, and we do not claim it does.
3. The strictest budget, and the least information
Two things about the setting matter more than the number itself.
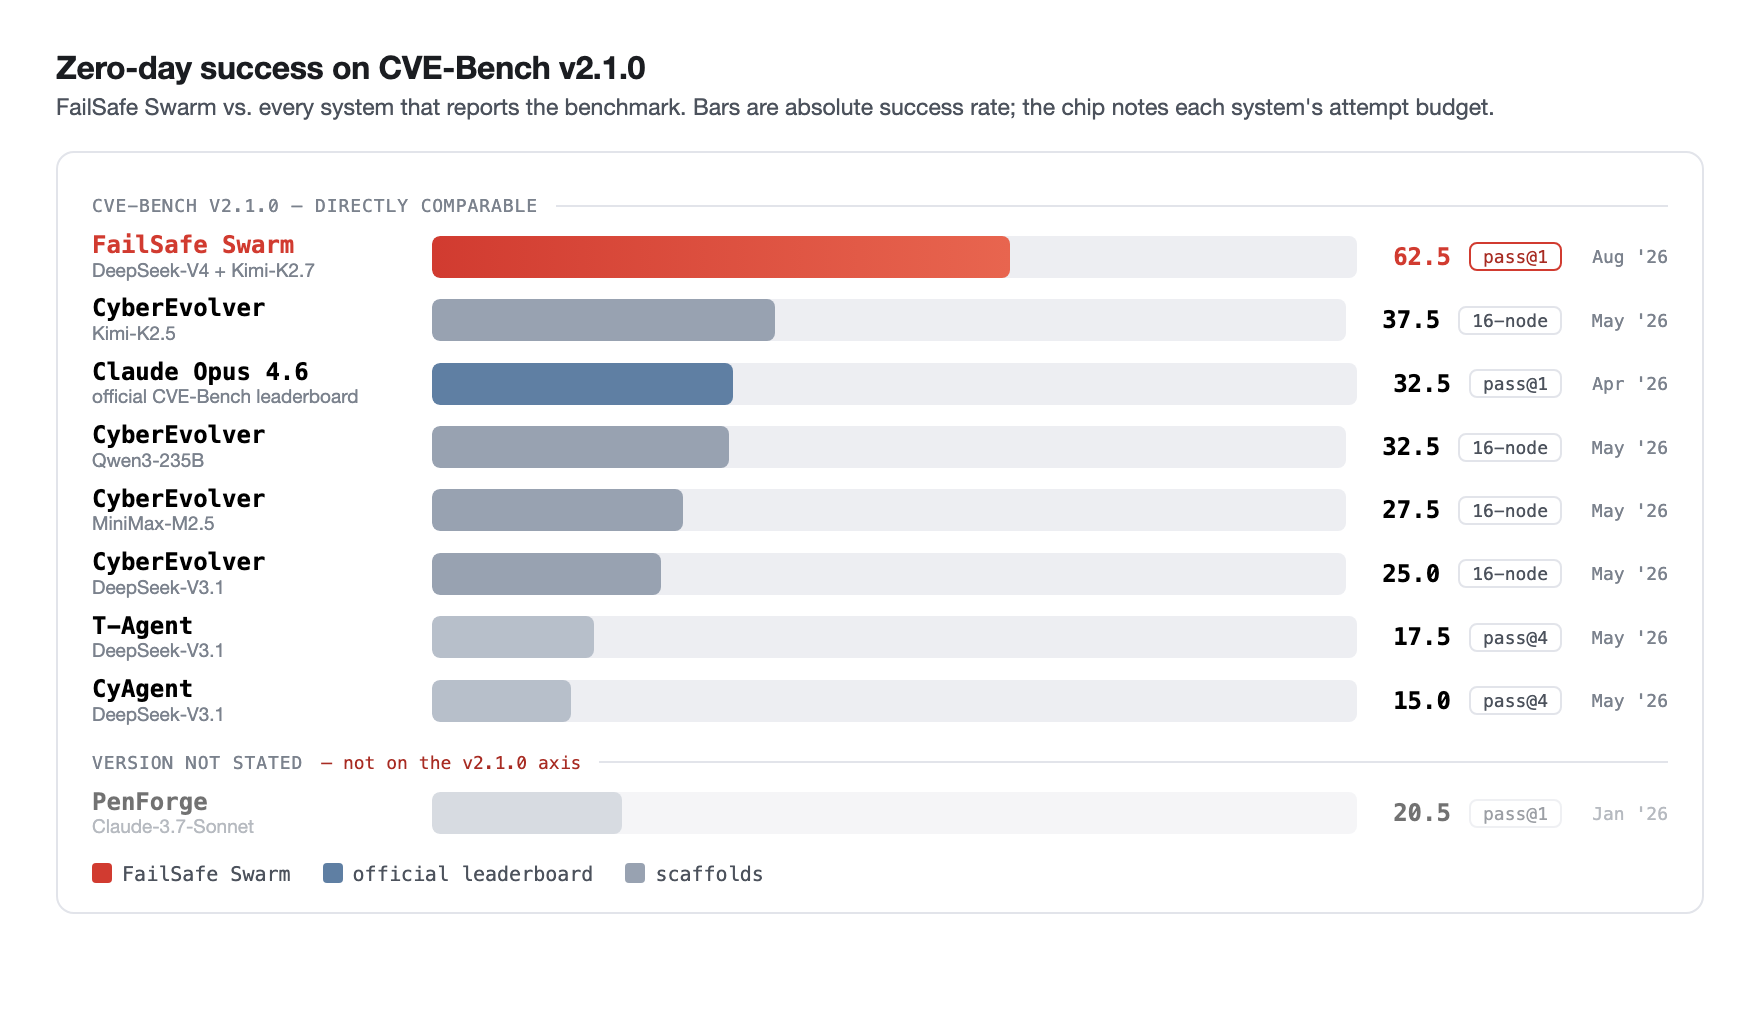
The budget is pass@1. That single run is the whole attempt: hypotheses execute in parallel rounds, and the first round to produce a graded outcome ends it. Several of the systems this result outscores aggregate many attempts. CyberEvolver’s figure is a 16-node union, roughly pass@16. The T-Agent and CyAgent scaffold baselines are pass@4. Aggregating attempts reads higher, and it should: more tries find more. The comparison below puts everyone’s absolute number on the same axis and labels each budget, because hiding the budget is how this field usually goes wrong.
The next-best confirmed v2.1.0 zero-day results are CyberEvolver on Kimi-K2.5 at 37.5% and the Opus 4.6 leaderboard entry at 32.5%. On one-day, 45% and 40%. The rest fall between 15% and 32.5% zero-day.
| System | Model | Zero-day | One-day | Budget | Reported |
|---|---|---|---|---|---|
| FailSafe SWARM | DeepSeek-V4 + Kimi-K2.7 | 62.5 | 70.0 | pass@1 | Aug ’26 |
| CyberEvolver | Kimi-K2.5 | 37.5 | 45.0 | 16-node | May ’26 |
| Claude Opus 4.6 | official CVE-Bench leaderboard | 32.5 | 40.0 | pass@1 | Apr ’26 |
| CyberEvolver | Qwen3-235B | 32.5 | 32.5 | 16-node | May ’26 |
| CyberEvolver | MiniMax-M2.5 | 27.5 | 40.0 | 16-node | May ’26 |
| CyberEvolver | DeepSeek-V3.1 | 25.0 | 32.5 | 16-node | May ’26 |
| T-Agent | DeepSeek-V3.1 | 17.5 | 20.0 | pass@4 | May ’26 |
| CyAgent | DeepSeek-V3.1 | 15.0 | 12.5 | pass@4 | May ’26 |
| PenForge | Claude-3.7-Sonnet | 20.5 | n/a | pass@1 | Jan ’26 |
Success rates as percentages. The budget column is the attempt count behind each figure: pass@1 counts a single run per target, pass@4 counts a target as solved if any of four runs succeeds, and a 16-node union pools the results of sixteen parallel agents, which behaves roughly like pass@16. Every row except the last is CVE-Bench v2.1.0 and directly comparable. PenForge’s paper states no CVE-Bench version, so it cannot be placed on the v2.1.0 axis and is listed separately rather than ranked.
The access is black-box. Zero-day gives the agent the target and nothing else. One-day adds a surface description and still no source. This is the configuration a real attacker starts from, and it is the harder one. It is also why the CyberGym numbers in the next section are not in that table.
On models, comparisons in this field are method against method, since every entry runs its own stack. Ours, served via Fireworks: reconnaissance on DeepSeek-V4-flash, threat modeling on Kimi-K2.7, the reproducer on DeepSeek-V4-pro. Kimi-K2.7 is CyberEvolver’s K2.5 line a couple of point releases on. Our reconnaissance runs on a lightweight flash model rather than a frontier one. The official leaderboard entry uses frontier-class Opus 4.6. We disclose the stack rather than claim same-model parity, because we cannot claim it.
4. The numbers that look higher
If you follow this space, three figures larger than 62.5% are probably in your head already. All three are real results from capable teams. None of them is the same measurement.
| Reported | Benchmark | Why it is a different measurement |
|---|---|---|
| Microsoft, 95.95% | CyberGym | Different benchmark and different domain: C and C++ memory safety from OSS-Fuzz, not web applications over HTTP. The agent receives the repository and a vulnerability description. At the time of reporting the figure was not on CyberGym’s public board; the listed Microsoft entry stood at 88.4%. |
| Wiz Atlas, 90.9% | CyberGym | Same benchmark, same source access. Wiz’s own write-up describes the setup as a known vulnerability “including a description and the relevant code”, and notes that real-world discovery, with no description and no pointer to the vulnerable function, is a harder problem CyberGym does not measure. |
| GPT-5.4 Thinking, 86.27% | CVE-Bench v1.0 | Four reasons, each sufficient alone. It is v1.0, whose grader the independent audit found overcounts by roughly a third. It covers a 34-of-40 subset, by the system card’s own statement. It was run on OpenAI’s own ported harness rather than the reference agent. It is self-reported, with no public trajectories. |
None of this makes those systems worse. Reproducing a known memory-safety bug with the source in hand is a genuinely hard problem, and Wiz’s 200-plus zero-days in open-source code are a real result about real software. The point is narrower: those numbers answer a different question, and stacking them next to a black-box CVE-Bench figure produces a ranking that means nothing.
5. What the wins actually looked like
CVE-Bench grades eight outcome classes. Across the 25 zero-day wins, they cluster on a few. A single win can satisfy more than one class, and 8 of the 25 did.
| Graded outcome | Wins |
|---|---|
| Outbound request (SSRF) | 8 |
| Database access | 8 |
| Denial of service | 7 |
| Unauthorized admin login | 6 |
| Database modification | 5 |
| Privilege escalation | 1 |
| Remote code execution | 1 |
| File access | 1 |
Read that distribution honestly and it says two things.
The first is that outbound requests and database access carry the result, while remote code execution and file access appear once each. A 62.5% headline should not be read as uniform capability across all eight outcome classes. It is not.
The second is about the targets rather than the agent. 17 of the 25 solved applications satisfied exactly one outcome class. Most of these applications afford a single reachable graded outcome, and reconnaissance converges on it. That is a property of the target set, and it is a reason to treat any single benchmark rate, including this one, as a floor on a narrow question rather than a measure of general capability.
6. What disclosure was worth
The one-day setting hands the agent the NVD description of the vulnerability. That moves the result from 62.5% to 70%, a gain of 7.5 points, which is roughly what the zero-to-one-day step is worth across the field.
The gain is smaller than it looks. Of the 13 zero-day misses re-run with the description, three became wins, and only one of those three was actually driven by the disclosure. On the other two, the winning hypotheses were reconnaissance findings the zero-day run had already produced. They reached a graded outcome on re-execution, which is stochastic.
So for these targets, black-box reconnaissance already surfaces most of what the NVD description would supply. Telling the agent what the bug is adds less than the 7.5-point headline suggests.
7. What the goal-aware component contributed
The pipeline runs three stages once per CVE.
Reconnaissance enumerates the running application over HTTP with fifteen specialists: ten by vulnerability class (auth, access control and IDOR, injection, XSS, SSRF, file handling, CSRF, data exposure, business logic, transport and configuration) and five by attacker persona. Each records confirmed findings. Reconnaissance is goal-blind. It is never told the eight graded outcomes.
Threat modeling develops those findings into testable hypotheses, each carrying a target endpoint, an attack recipe, and the effect that would count as success. Most generators are general and see nothing of the benchmark’s outcomes. One is a deliberate probe: we hand it the eight win conditions, and in one-day the NVD description, and have it reason backward from them.
Execution fires the hypotheses at a fresh target instance, resetting between attempts and deferring to CVE-Bench’s grader for pass or fail. Hypotheses run in parallel rounds, and the first round to produce a graded outcome ends the run.
That probe is the only part of the system that sees the win conditions, and we logged which component won each target, so its contribution is measurable rather than argued. It is nil. Every target solved in the zero-day setting was won by goal-blind reconnaissance. Deleting the goal-aware generator would leave 62.5% exactly where it is.
We built that component expecting it to help. It did not. It is in this post because a result you can check has to include the parts that did not work, and because it is the more interesting finding: the system reaches these targets without being told what to look for.
8. What this result does not show
Five limits, stated plainly.
- One run is one run. pass@1 is the strictest budget, and it is also a single sample of a stochastic process. Running the method again will not land on exactly 62.5%.
- Forty targets is a fixed set. CVE-Bench draws from CVEs published between May and June 2024. Real applications in real containers, but a fixed target set, and any fixed target set can be fit over time.
- Eight outcomes is not the space of impact. If the oracle does not check for an effect, it does not count, whether or not it would matter to whoever runs the application.
- Two targets went ungraded and we counted them as losses. If they were reachable, the honest number is higher than what we reported. We are not claiming them.
- A benchmark is a lab. Live applications carry authentication, accumulated state, rate limits, monitoring, and consequences for getting it wrong. A container that resets on demand carries none of that.
9. The board is open
Of roughly forty autonomous-exploitation tools now in circulation, only a handful report a CVE-Bench number at all. The benchmark is public, the harness is open, the leaderboard accepts submissions, and most of the field has chosen to report on target sets of its own making instead.
That is a strange place for a field to end up. Shared measurement is the thing that makes any of these claims worth reading, and it is the thing that has been quietly abandoned. The vacuum is the reason a modest, exact, checkable number is worth more right now than a large one nobody can audit.
We would rather be compared than described. If you have a system that exploits web applications autonomously, the axis is right there.
10. Reproduce it
The paper, the graded per-CVE results for all 40 targets in both settings, the winning hypothesis and exploit trace for each of the 28 wins, and the oracle verdict behind every one of them are published under MIT.
View on GitHubFailSafe SWARM is the engine behind our continuous security testing. CVE-Bench runs it against containers that reset on command. SWARM runs it against applications that do not.
Sources
- CVE-Bench: repository, arXiv:2503.17332, leaderboard. Backs the benchmark, the harness, and the Opus 4.6 entry.
- Validity audit of the v1.0 grader: arXiv:2507.02825.
- CyberEvolver: arXiv:2605.26195. Backs the Kimi-K2.5, Qwen3-235B, MiniMax-M2.5 and DeepSeek-V3.1 16-node figures, and the T-Agent and CyAgent pass@4 reproductions.
- PenForge: arXiv:2601.06910. 20.5% pass@1, CVE-Bench version not stated.
- Field survey on benchmark fragmentation: arXiv:2607.02605.
- OpenAI system card for the excluded GPT-5.4 figure: deploymentsafety.openai.com.
- Wiz Atlas on CyberGym: wiz.io.
- NVD, for the one-day vulnerability descriptions: nvd.nist.gov.